library(httr2)
library(dplyr)
library(purrr)
library(tidyr)
library(stringr)
library(ggplot2)Evolution of gas prices in Llinars del Vallès
Use this R libraries:
theme_set(
  theme_bw() +
  theme(
    axis.title = element_blank()
  )
)
Define function to retrieve information:
get_gas <- function(filtro, args) {
  paste0(
    "https://sedeaplicaciones.minetur.gob.es",
    "/ServiciosRESTCarburantes/PreciosCarburantes/EstacionesTerrestresHist/",
    filtro, paste(args, collapse = "/")
  ) %>%
    request() %>%
    req_perform() %>%
    resp_body_json() %>%
    .[["ListaEESSPrecio"]] %>%
    map(\(x) as_tibble(list_flatten(x))) %>%
    bind_rows() %>%
    janitor::clean_names()
}
Retrieve yesterday’s gas prices in catalan provinces:
prov <- c("08", "43", "17", "25")

gCat <- map(prov, \(x) get_gas(
  filtro = "FiltroProvincia/",
  args = c(format(Sys.Date() - 1, "%d-%m-%Y"), x)
)) %>%
  bind_rows() %>%
  mutate(precio = as.numeric(gsub(",", ".", precio_gasolina_95_e5)))
Summary of gas stations and price statistics per province:1
gCat %>%
  summarise(
    n = n(),
    mean = mean(precio, na.rm = TRUE) %>% round(3),
    median = median(precio, na.rm = TRUE) %>% round(3),
    sd = sd(precio, na.rm = TRUE) %>% round(3),
    .by = provincia
  )
# A tibble: 4 × 5
provincia n mean median sd
<chr> <int> <dbl> <dbl> <dbl>
1 BARCELONA 799 1.56 1.59 0.114
2 TARRAGONA 236 1.56 1.62 0.109
3 GIRONA 270 1.57 1.60 0.098
4 LLEIDA 184 1.53 1.58 0.107Prices from the largest providers in Catalonia, 2025:
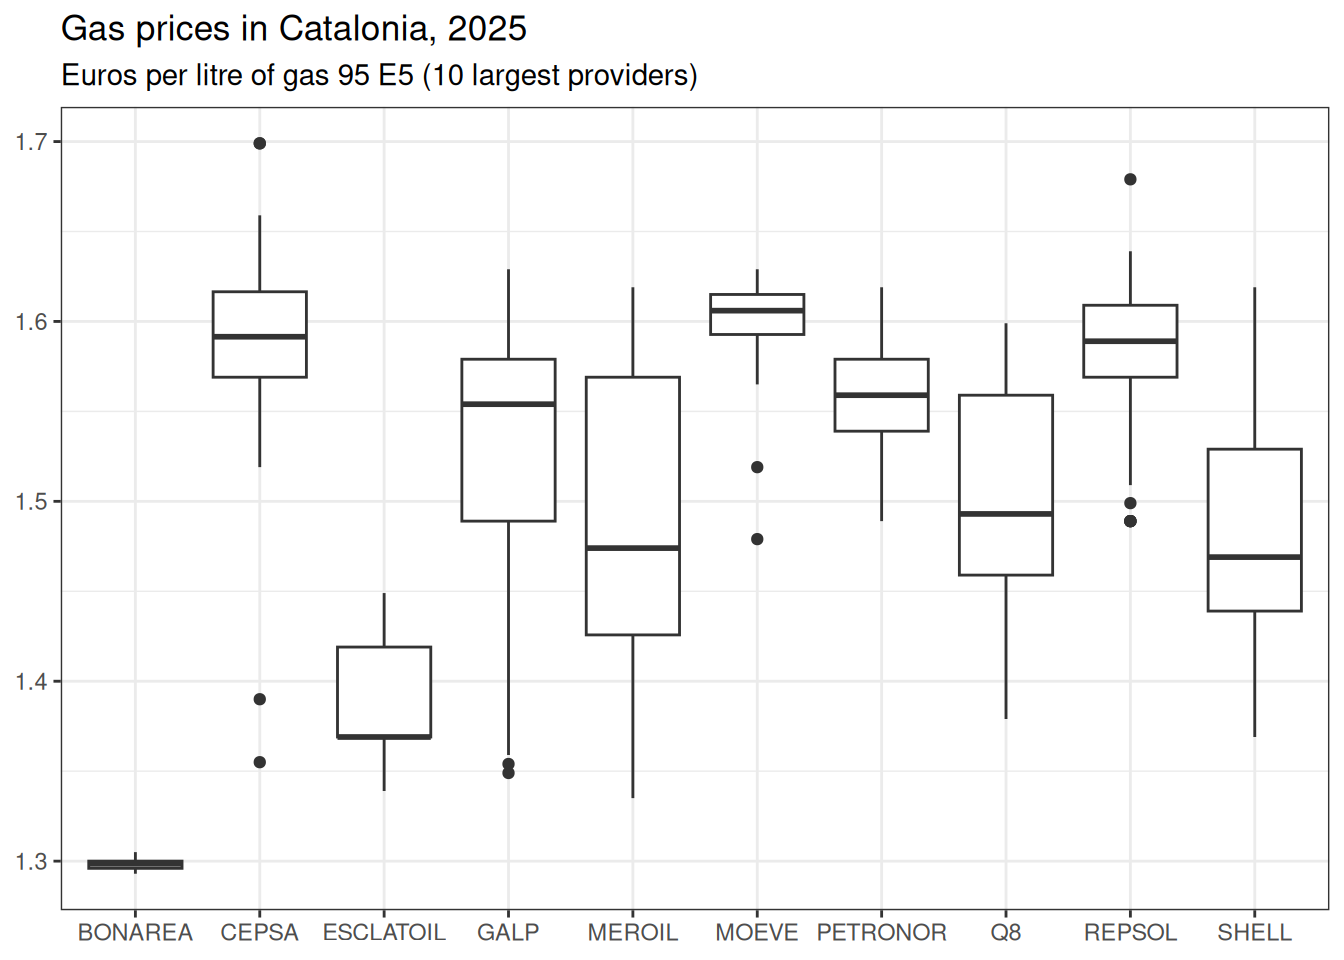
gCat %>%
  filter(rotulo %in% (
    summarise(gCat, .by = rotulo, n = n()) %>%
      arrange(n) %>% pull(rotulo) %>% tail(10)
  )) %>%
  drop_na() %>%
  select(rotulo, precio) %>%
  ggplot(aes(rotulo, precio)) +
  geom_boxplot() +
  labs(
    title = "Gas prices in Catalonia, 2025",
    subtitle = "Euros per litre of gas 95 E5 (10 largest providers)"
  )
Narrow down geographical scope: Consider municipalities nearby Llinars del Vallès
muns <- gCat %>%
  summarise(n = n(), m = round(mean(precio), 3), .by = c(municipio, id_municipio)) %>%
  filter(str_detect(municipio,
    "Llinars|Cardedeu|Vilamajor|Palautordera|Sant Celoni"
  ))

knitr::kable(muns, caption = "Average price and station count per municipality")| municipio | id_municipio | n | m |
|---|---|---|---|
| Cardedeu | 908 | 4 | 1.650 |
| Llinars del Vallès | 973 | 3 | 1.669 |
| Sant Antoni de Vilamajor | 1060 | 1 | 1.639 |
| Sant Celoni | 1065 | 4 | 1.629 |
| Santa Maria de Palautordera | 1123 | 3 | 1.610 |
Retrieve daily prices for Gasolina 95 - E5 at all locations within scope. Define request parameters:
# api end point
fil <- "FiltroMunicipioProducto/"

t <- Sys.time()
# parameters
anys <- 1/12
mun <- set_names(muns$id_municipio, muns$municipio)
prod <- set_names("01", "gas95-e5")
date <- format(Sys.Date() - 1:(anys*365), "%d-%m-%Y")
params <- expand_grid(date, mun, prod)

gas <- apply(params, 1, \(x) mutate(get_gas(filtro = fil, args = x), date = as.Date(x[1]))) %>%
  bind_rows() %>%
  mutate(precio = as.numeric(gsub(",", ".", precio_producto)))
t <- Sys.time() - t
Evolution of average price per municipality:
summarise(gas, .by = c(municipio, date), price = mean(precio), desv = sd(precio)) %>%
  ggplot(aes(x = date, y = price, colour = municipio)) +
  geom_line() +
  labs(colour = "Municipality", title = "Gas prive evolution, last 30 days")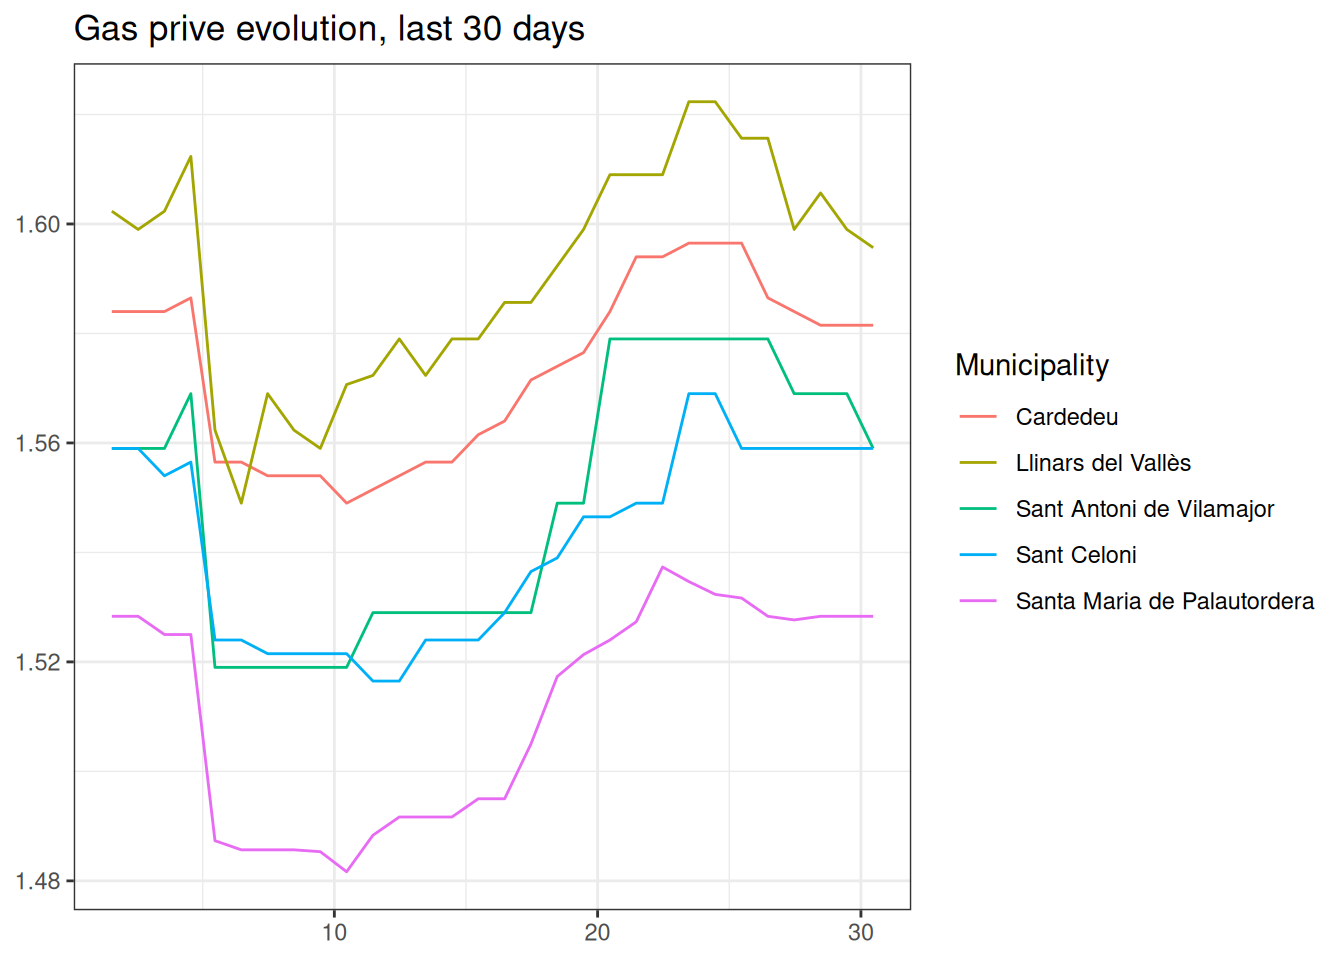
Footnotes
Considering 95 gas - E5↩︎